by Akinsande Olalekan
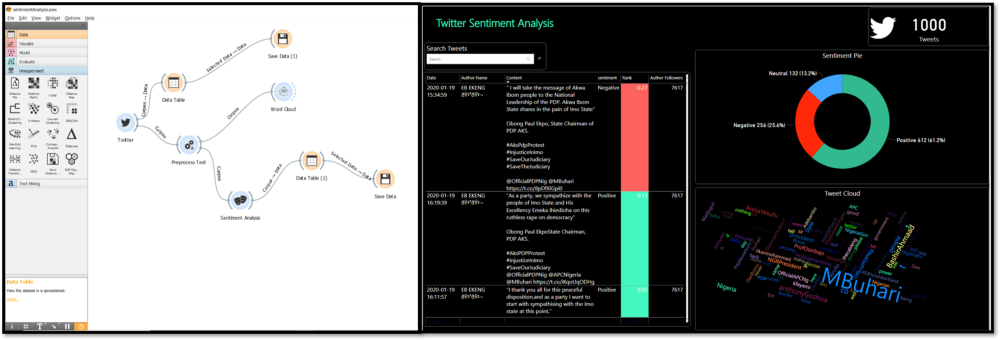
In the first part of this article, we learned how to create a twitter developer account, how to download and install Orange3 Text Mining, and how to stream twitter data and do sentiment analysis with Orange3 Text Mining.
In this article, we will learn how to create a sentiment analysis dashboard in powerbi and deploy it to the web. This article is a continuation of Twitter Sentiment Analysis with Orange + Vader + PowerBi (Part 1); if you have not read the article, please do so.
Before we start, what is PowerBi in the first place? PowerBi is a business intelligence service by Microsoft that provides users with tools for Aggregation, Analysis, Data-Sharing, and Visualization. There are several possible ways to work with Power BI- Power BI Service(Web), Mobile, Embedded and PowerBi Desktop (Desktop App). Without much ado, let’s get started!
Step 1: Download and Install PowerBi Desktop
Power BI Desktop allows you to ingest, transform, integrate and enrich data by connecting to various data sources. This FREE desktop application simplifies data evaluation and sharing with scalable dashboards, interactive reports, embedded visuals and many more.
To download PowerBi Desktop, all you have to do is:
- Go here: https://www.microsoft.com/en-us/download/details.aspx?id=58494
- Click the download button.
- On the next page, select the checkbox to download the powerbi version that suits your system and click next to download.


pagePowerBi Download
To install it, simply run the downloaded .exe file and follow straightforward installation wizard prompts.
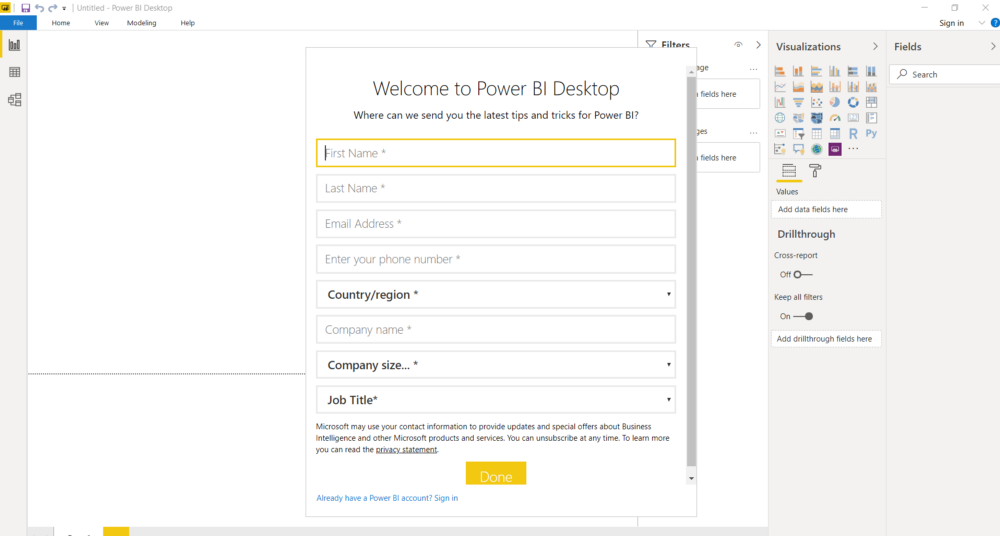
The next step is to sign up for a Powerbi account (if you would like to do so later, you can skip the registration process by clicking ‘Already have a Power BI account? Sign in’ and close the sign-in page.) If you already have an account, just use your credentials. Note: if you have an official email, I will recommend you create the PowerBi account because there are some visuals that we will import from the PowerBi Marketplace; doing this requires having a powerbi account. Now, we are ready to explore.
Step 2: Import Dataset into PowerBi
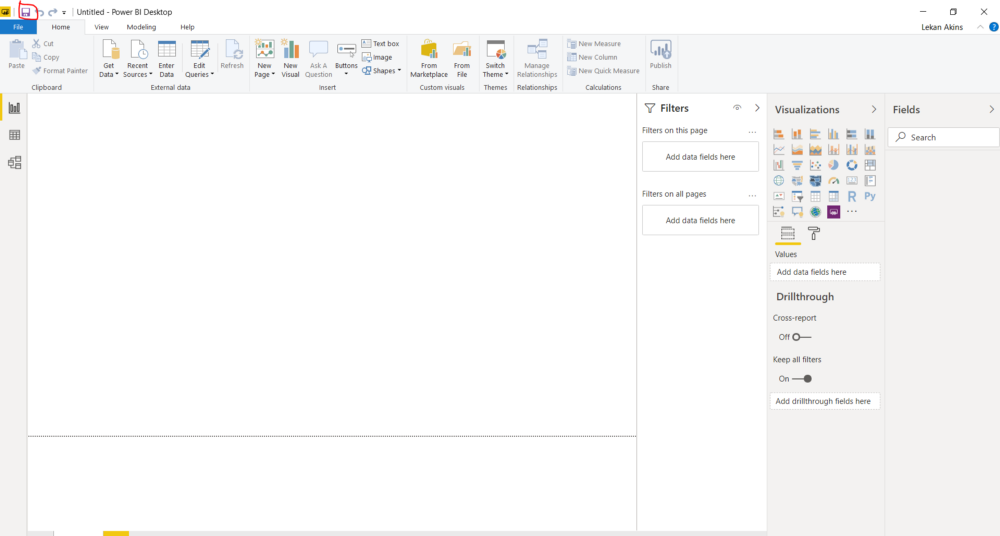
Best Practice: Save the report
As a best practice, you should save your PowerBi report before doing any other thing. To save your report, click the save button on the upper left corner of the page. Now, let’s import our sentiment analysis data ( the .csv file that was exported from the Orange3 Text Mining in the first part of our tutorial. You can download the data by clicking here .)
To build a dashboard, you have to connect to a data source. The following are the steps you need to follow to connect to a data source:
- Click on the ‘Get Data’ button.
- Select the source type; in this tutorial, we are working with a Text/CSV file

3. Locate the data in the file explorer and select it; once you connect successfully to our data source, you will see the window below:
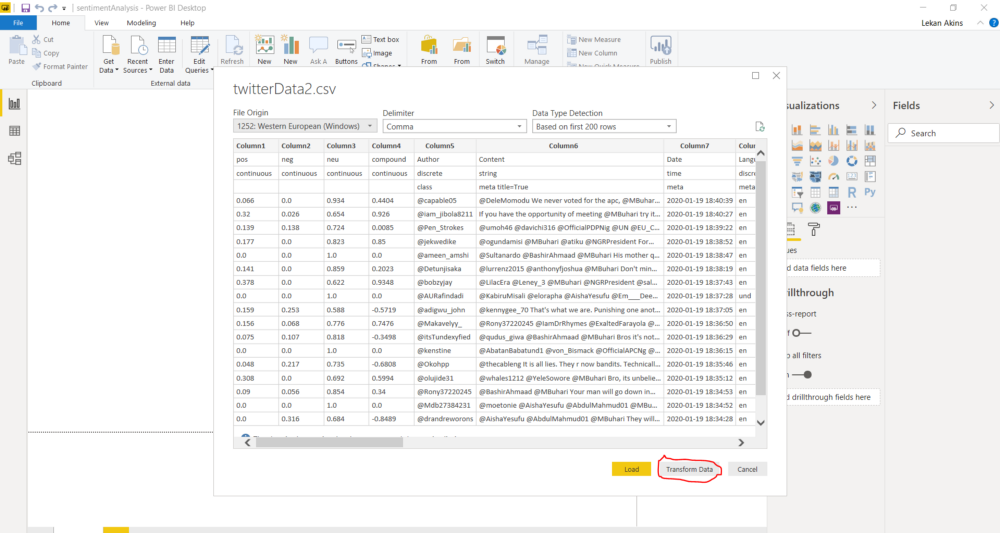
Click Transform
Step 3: Preparing Data for the Load
Data doesn’t always come clean and prepared. Before loading data into powerbi, it is always good practice to clean the data in Power Query. To prepare data for load, click the ‘Transform Data’ button.
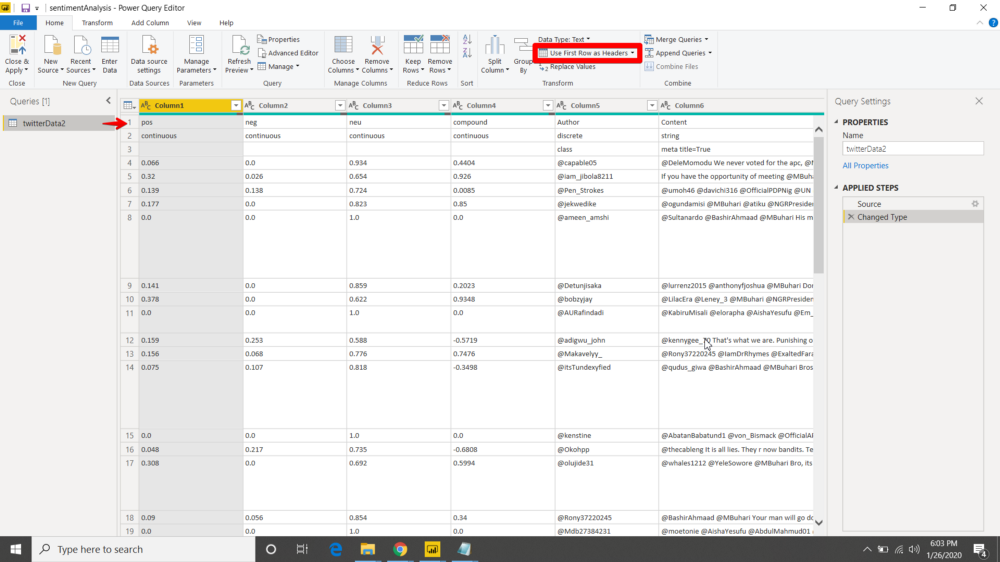
Power Query view
Follow these steps to prepare the data for load:
- Use the First row as a header: the first row of our data is good to serve as our data table header. On the Home ribbon, click ‘User first row as headers’.
- Remove the first 2 rows: we don’t need the first 2 rows on our data table, so let’s get rid of it. On the Home ribbon, click ‘Remove Row’ and click ‘Remove Top Rows’

Remove Rows
and input 2 in the Remove Top Row dialogue box as shown in the image below:

Remove Top Rows
3. Change Data Type: To change Data Type, click the data type button on the left side of the column name. We need to change some data to their correct data types; the following columns should be changed to Decimal Numbers, ‘pos’,’ neg’,’ neu’, and ‘compound’; the other numeric columns should be changed to the Whole Number. The Date column should be converted to Date/Time.

4. Create a Conditional Column: Let’s create a conditional column called ‘Sentiment’. The Sentiment column will help us identify the Negative, Positive and Neutral sentiments from the ‘Compound’ score. Follow these steps to create the conditional column.
4a. On the Upper ribbon, click ‘Add Column’ and select ‘Conditional Column’

4b. Now input the conditions; if ‘compound’ is less than 0, the sentiment is ‘negative’; if ‘compound’ equals 0, the sentiment is ‘neutral’; if ‘compound’ is greater than 0, the sentiment is ‘positive’. See screenshot below:

5. Load Data: Now that we prepared our data, let’s go ahead and Load. Click the Close & Apply button to load data.

Step 4: Building the Dashboard
Now that we have our data cleaned, let’s go ahead and build the dashboard.
Follow these steps to build the dashboard:
- Change the dashboard background: see snapshot below and follow the steps below:
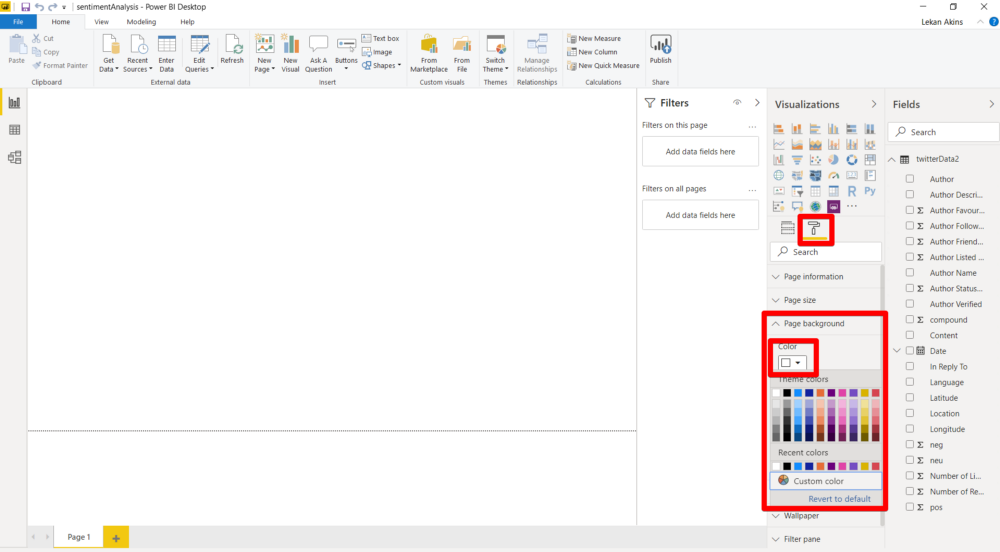
Formating the background
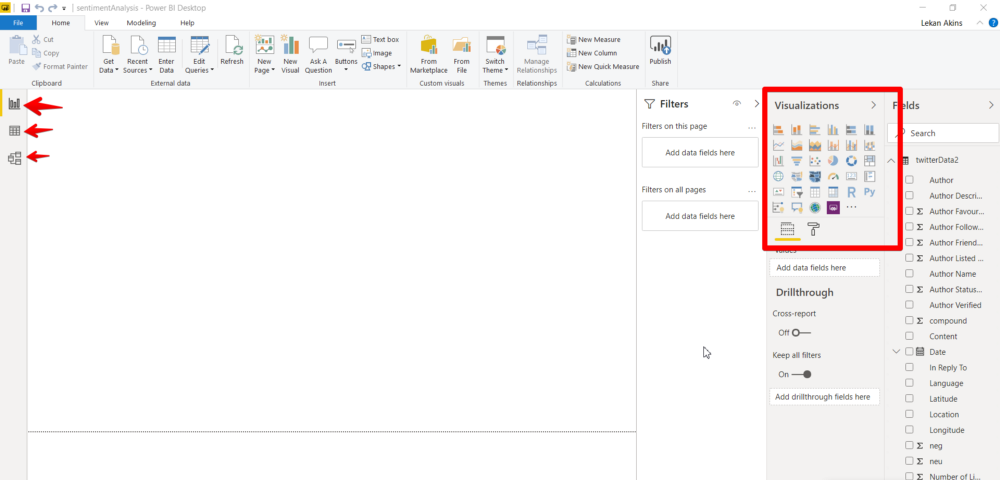
1a. On the Visualisation pane, select the format icon
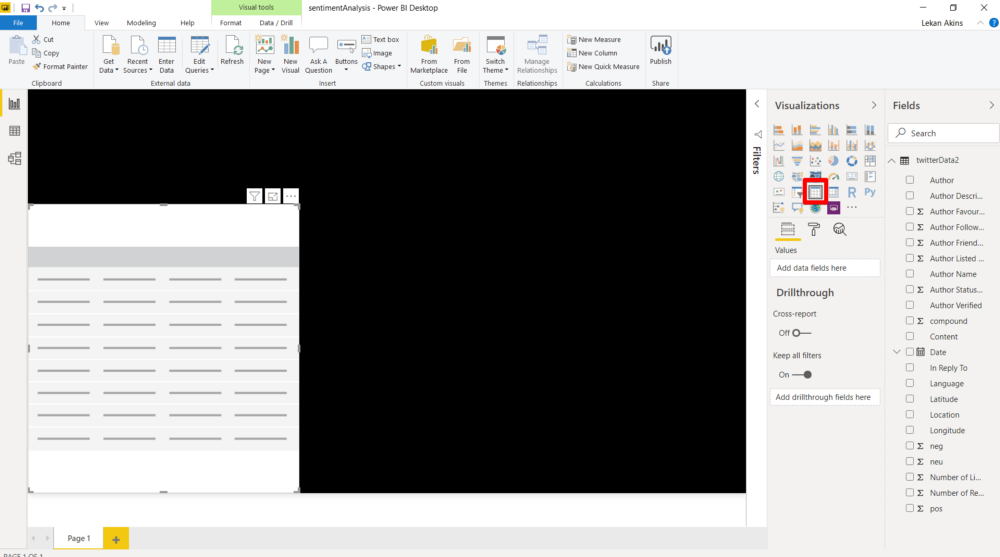
1b. Select the Page background, click the Color and select a black color. Turn color transparency to 0%. The background is now black as shown in the snapshot below:
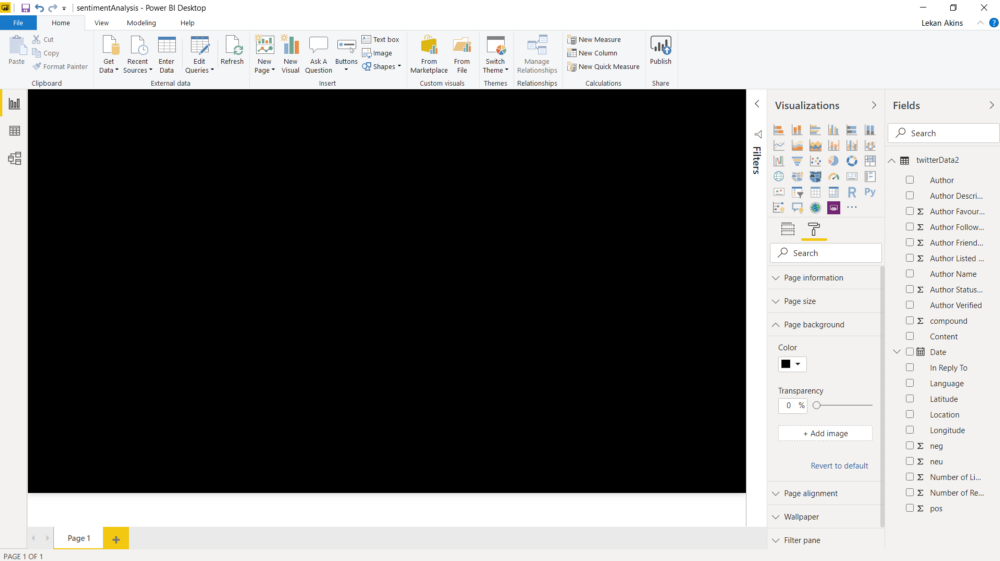
the black background
2. Visual 1- Table: To import a visual from the visualization pane to the report space, click the visual and you’ll see it on the report space. We will start by bringing the Table visual to the report space.
Now that you have a Table in the Report space, do the following:
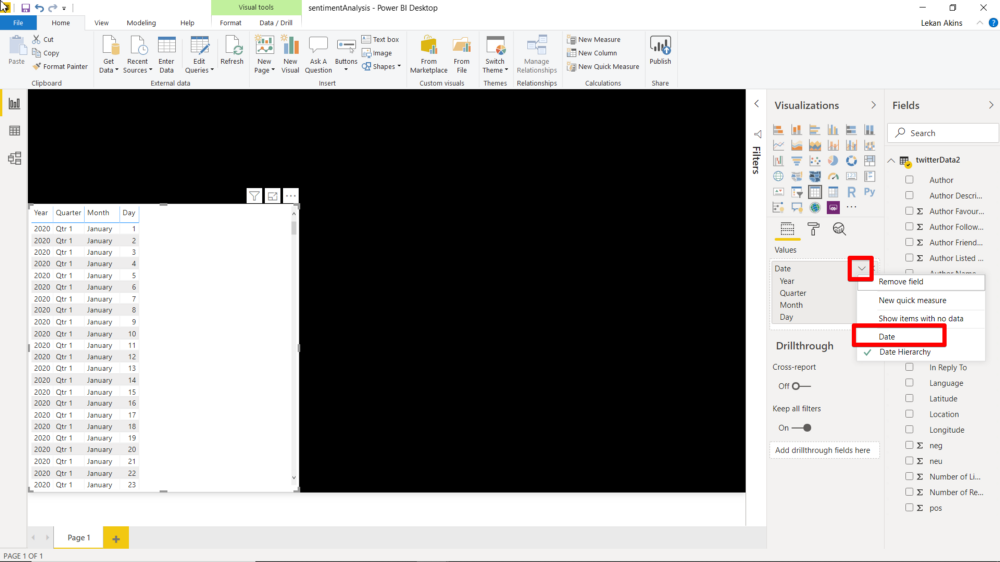
a. On the Data Fields, drag the date column to the value field of the table as shown in the screenshot below

We date is being displayed hierarchically; this is not what we want. So, let’s change the Date from hierarchy to normal date as shown in the screenshot below:
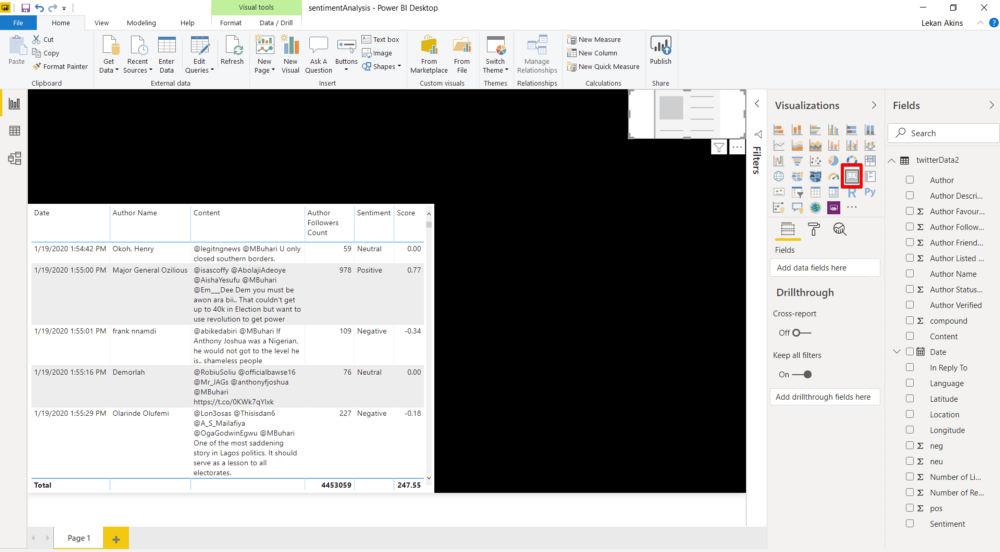
b. Drag the ‘Author Name’, ‘Content’, ‘Sentiment’, ‘Author Follower Count’ and the ‘Compound’ columns to the Value Field of the Visual. Rename ‘Compound’ as ‘Score’ by double-clicking it on the Value pane
Visual 2- Card: To avoid your current visual being changed by the new visual, click on the background of your report before selecting the Card visual. On the Visualisation pane, click the Card visual as shown in the screenshot below:
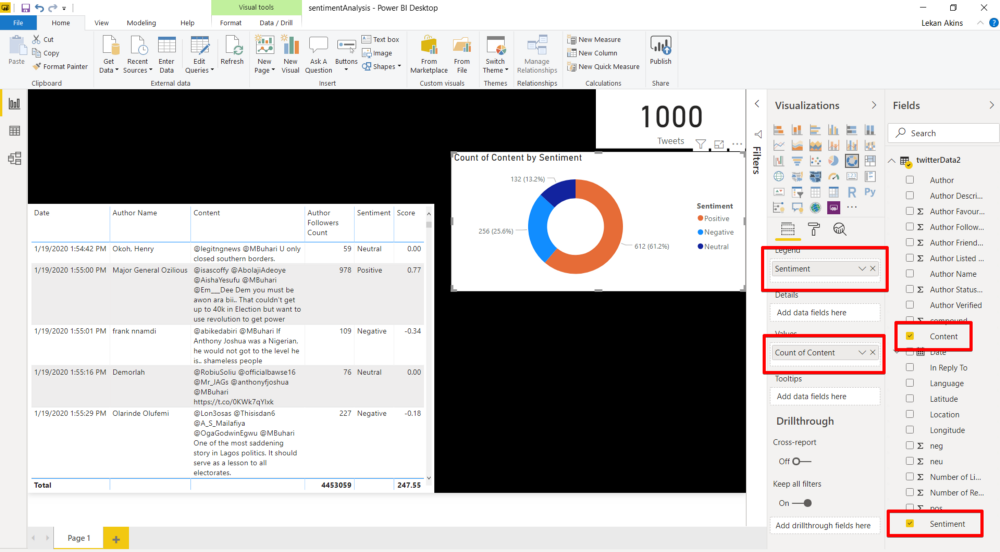
Now that you have the Card in the Report space, drag content into the Visual field. By default, the Card will show the First Sentence, change this by clicking the drop-down arrow on the visual and select ‘count’ as shown below:

Remember, you can rename a field name by double-clicking the name on the value field and rename it.
Visual 3- Donut: To avoid your current visual being changed by the new visual, click on the background of your report before selecting the Donut visual. Drag the ‘Sentiment’ field to the ‘legend’ and the ‘Content’ field to the ‘Value’ as shown in the screenshot below.
Visual 4- Word Cloud: Word cloud does is not among the default visualization in PowerBi, so we will have to import it as a custom visual from the PowerBi Marketplace. To import a visual from the marketplace, click the ellipse (…) and select ‘import from marketplace’ as shown in the visual below:
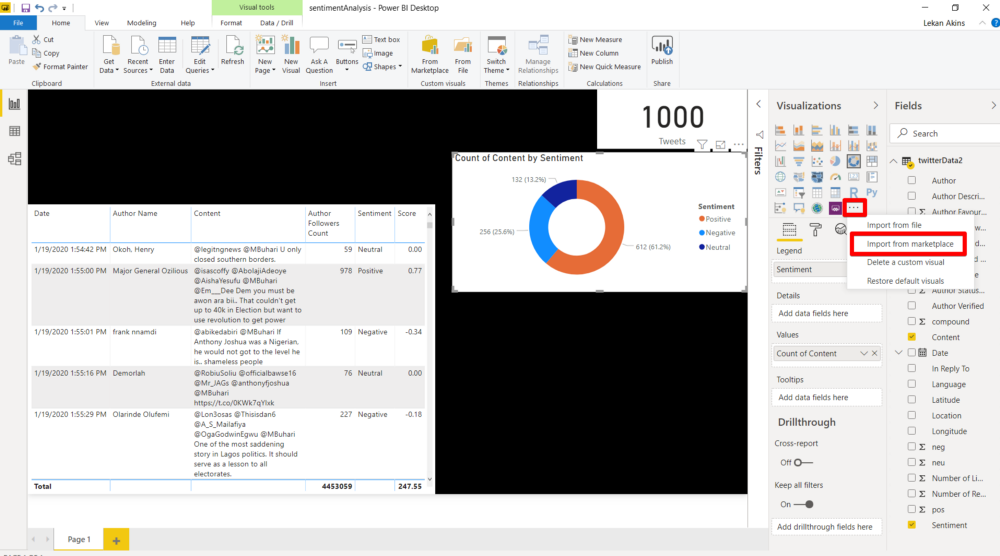
Note: you must be signed in to powerbi to import visual from the marketplace.
Search for ‘Word Cloud’ in the marketplace and click ‘Add’ to import the custom visual into your visualization pane as shown below:

Now that you have imported the visual from the marketplace, click the visual to add it to your Report space. Drag the content field to the category of the visual as shown in the image below:

Visual 5- Text Filter: Repeat the same process we used to import the Word Cloud visual from the marketplace to import the Text Filter. Click the Text Filter visual to add it to the report space. Drag the ‘Content’ data field into the visual field as shown below:

Visual 6- Text Box: On the ‘Home’ ribbon, click the text box icon and type, ‘Twitter sentiment Analysis’ into it as shown in the visual below:

Now you have a ready to go PowerBi Dashboard, you can choose to format this dashboard as you desire. You can read more on how to format powerbi visuals here. Finally, let’s publish our dashboard to the web so that anyone on the internet can interact with it.
Publishing to the Web
You need to have a powerbi service account to publish your dashboard.
A PowerBi Dashboard becomes interesting when you can share your beautiful dashboard. To make your dashboard available on the web, follow these steps:
- Publish: Click the ‘Publish’ button to push the dashboard to your powerbi service account.
- Once the dashboard is published, log in to your powerbi service account here
- Your newly published dashboard can be found under the ‘Report’ segment of your ‘My Workspace’. Click the dashboard to view on the web.
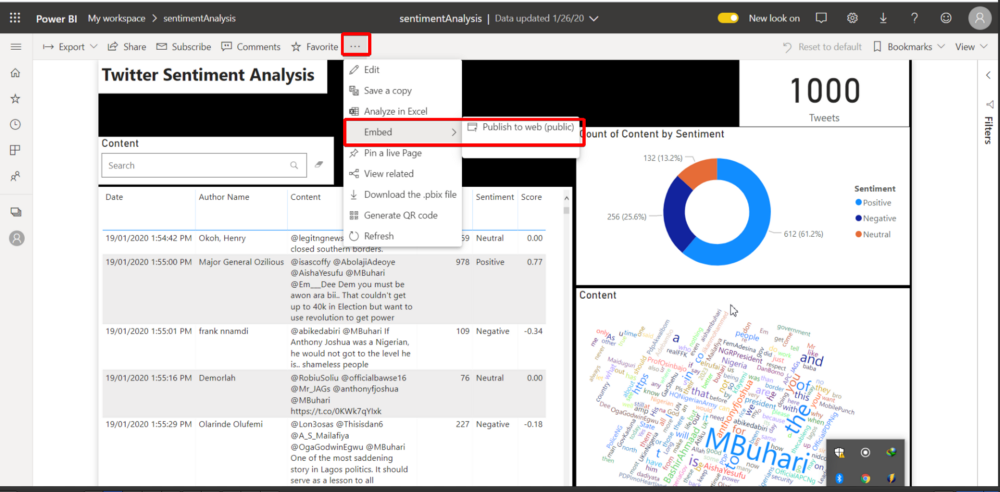
- To create an embedded link, you need to publish to the public web as shown in the screenshot below:
5. Publish the dashboard and a link will be generated for you as shown below:

Final Words
Congratulations on making it to the end of this article. Our dashboard is available for view here https://bit.ly/sentimentLekan. Feel free to interact with it.
Please drop your questions and comments.
Cheers!!!