pic7.jpg

October 5, 2022 0

Talents are everywhere, but opportunities are not.

Nearly 220 million individuals, with a median age of 17, live in Nigeria, making it the most populous country in Africa. Some of the most critical problems facing the country include the high rate of unemployment, the high rate of poverty, little or no access to electricity, and costly access to the internet. While these challenges make it more difficult to access the world through digital devices, especially for learning critical digital skills, the youth of Nigeria have largely embraced technology, creating a massive talent opportunity just waiting to be unlocked. Data Scientists Network (DSN), formerly known as Data Science Nigeria, is an organization focused on doing just that and is working to support the development of one million Artificial Intelligence (AI) talents who can catalyze solution-oriented innovations for emerging market.

For the last five years, DSN has been working hard and intentionally to expand access to AI education and expertise within the field, regardless of socio-economic status and resource challenges of the continent. For instance, DSN has continued to explore context-aware and homegrown approaches to overcome lack of internet, power, digital devices, and AI expertise in Africa. DSN’s model is an inclusive one with large-scale AI knowledge transfer through community learning groups, offline learning contents, a global network of mentors from the first world, hands-on project-based learning, and direct deployment through project participation and job support.

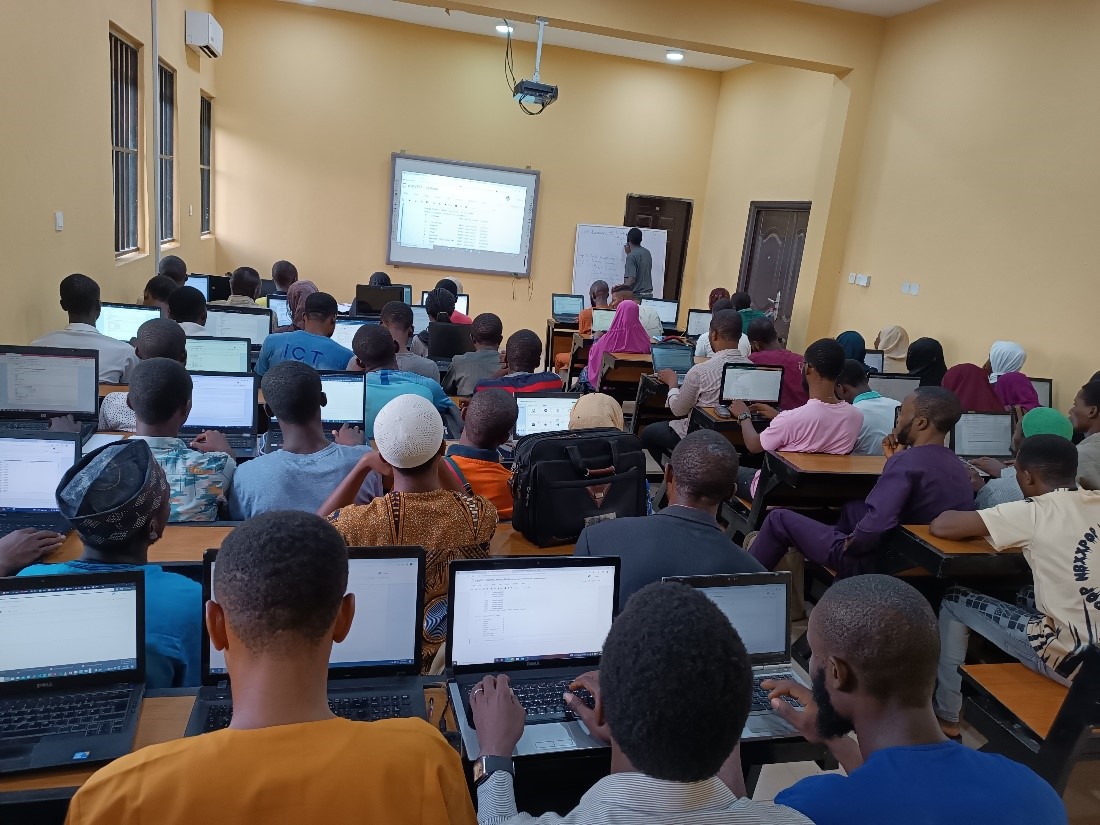
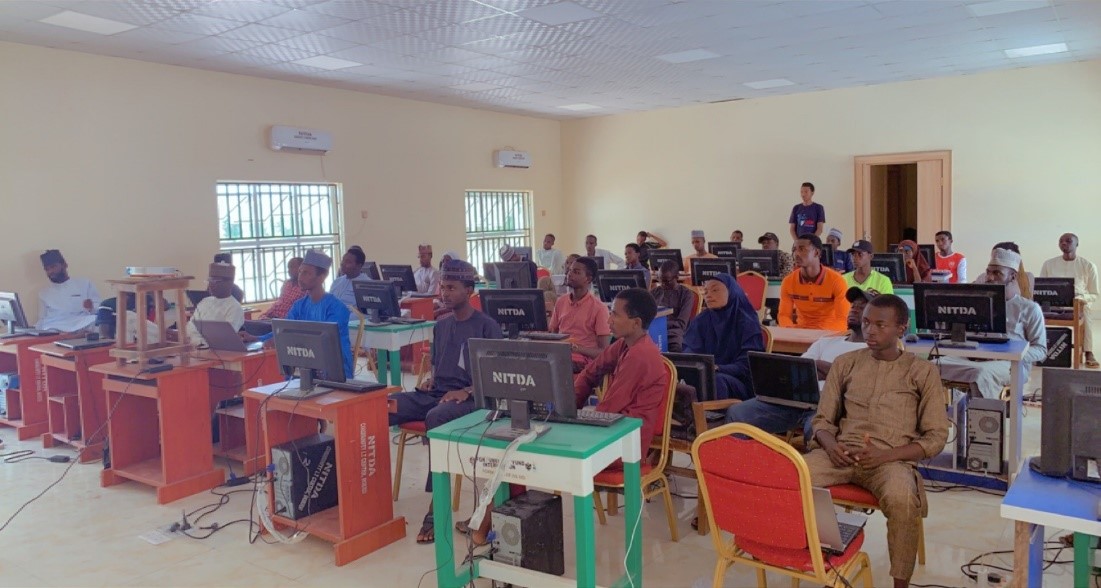
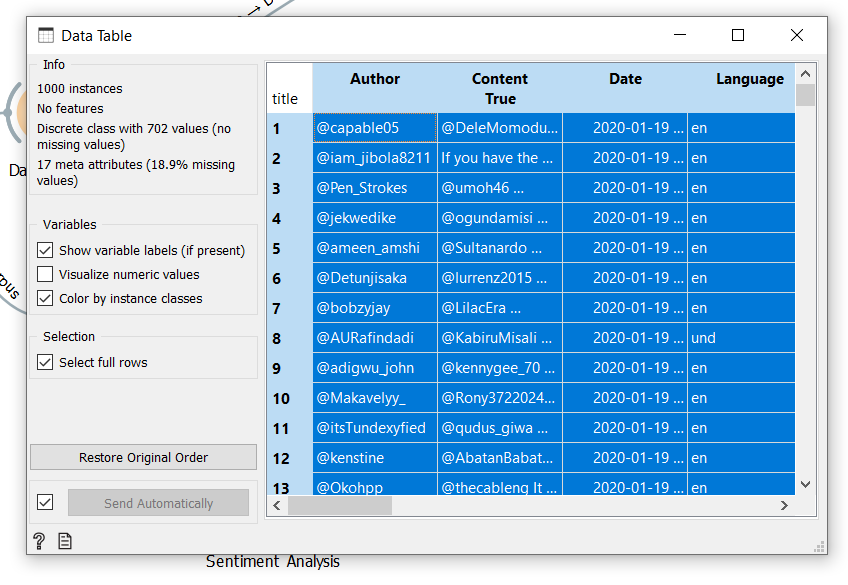
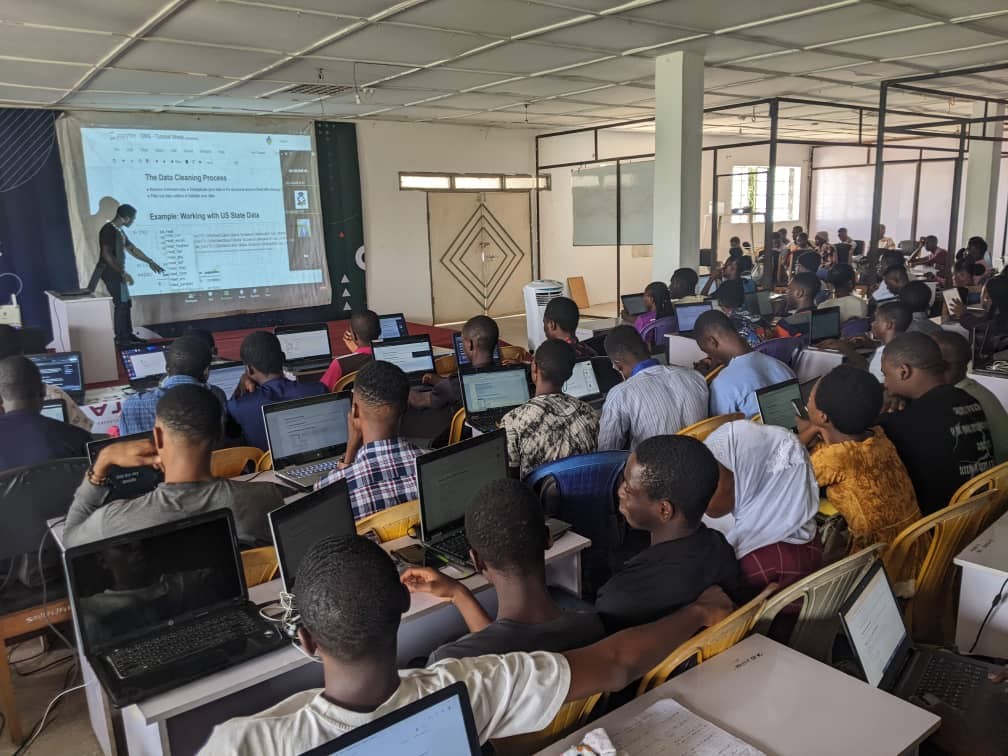
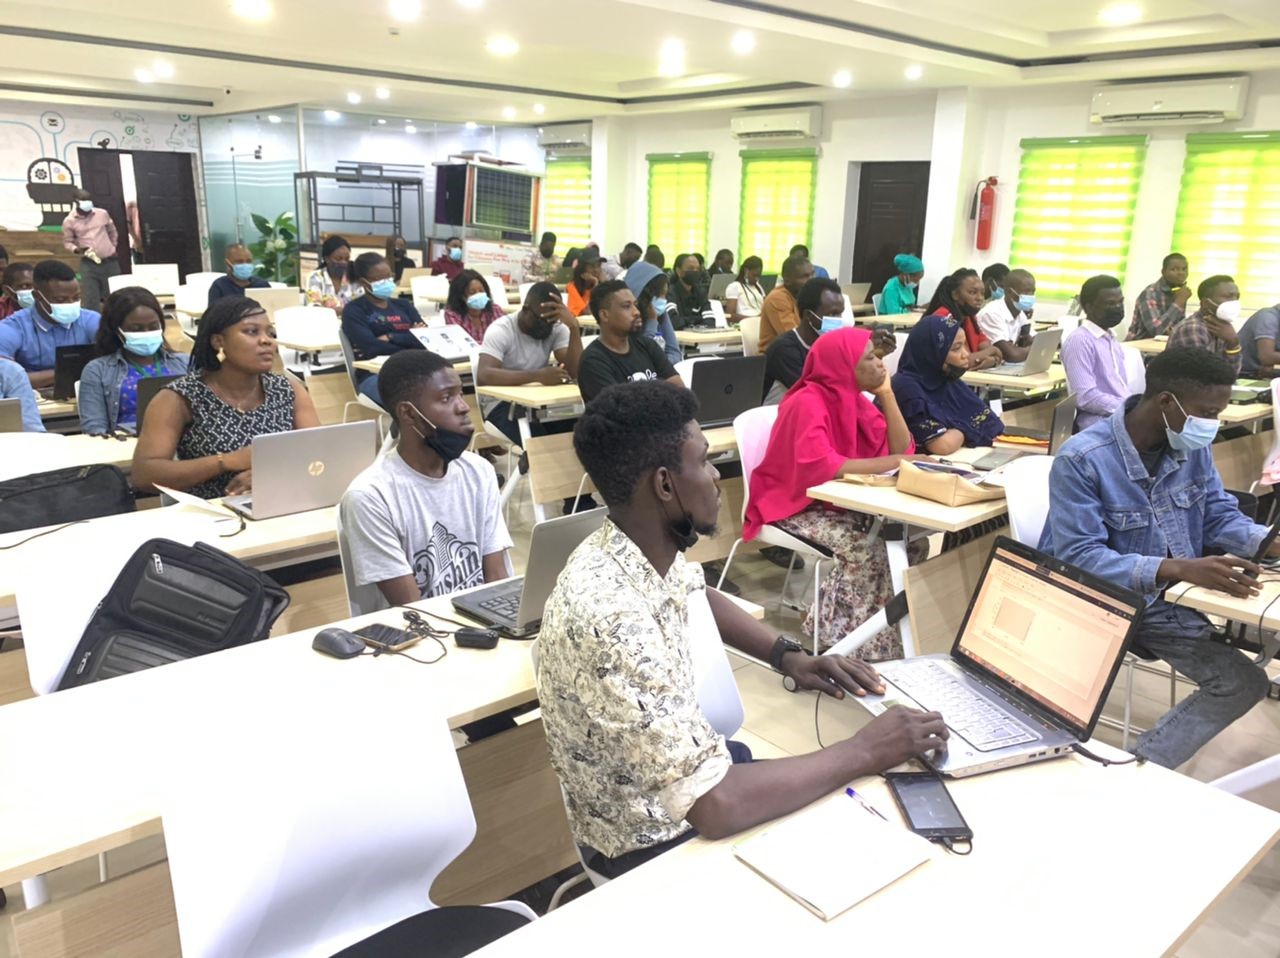
DSN creates communities of AI learners all around Nigeria, providing grants for internet access, devices, and electricity. These communities meet weekly, where they can solve problems and learn from one other. Through this process, DSN has created about 100 vibrant learning communities across Nigeria. These communities are trained by our global network of mentors, which includes top AI professionals, AI startup founders, and some DSN Alumni, who are based in the US, UK, Canada and Europe. Many of these interactions are recorded and made available online and offline. For offline use, these videos are aggregated and stored in a physical storage device called the AI Knowledge Box. This resource is duplicated, and a copy is shared with each community to ensure they have access to world-class AI knowledge offline—anywhere and anytime they want. DSN also supports world-class events where participants are engaged through hands-on, project-based activities and gain real-world problem-solving skills in the process. Additionally, DSN absorbs top talents into its talent pool, supporting and mentoring the development of job-ready candidates in the process.

DSN’s unique approach has secured global recognitions. The World Economic Forum has recognized DSN for its dynamic approach to education in Africa. UNESCO Science Report has also recognized DSN’s model as one of the best ways of learning outside the four walls of a university. Thus far, DSN has trained over 500,000 individuals, created about 100 local communities, and extended AI introductory knowledge to over 3 million people through its free learning contents. DSN has quickly grown into the number one AI learning community and solution delivery network in Africa—as well as one of the world’s largest communities of digitally savvy people. DSN was recognized for this outstanding community-building achievement when it received the Matthai Impact Award at Deep Indaba. DSN has received several other accolades and recognitions by several governments and organizations. Collectively, these serve as a testament to the effectiveness of DSN’s model. Some of the awards are listed below.

  1. IRCAI UNESCO – Listed in the IRCAI/UNESCO Top 100 AI products in 2021 – with two products listed for solving sustainable development goals – https://bit.ly/IRCAI_2021-Report
  2. Economic and Computation Conference 2021 award – The best academic poster at ACM Conference on Economics and Computation (EC’ 20) – https://bit.ly/DSN-Best-Postal-Award_GCEC2020
  3. XPrize Award 2021 – The only African finalist in the competition on building advanced AI algorithms to address COVID19 – https://bit.ly/XPRIZEPress


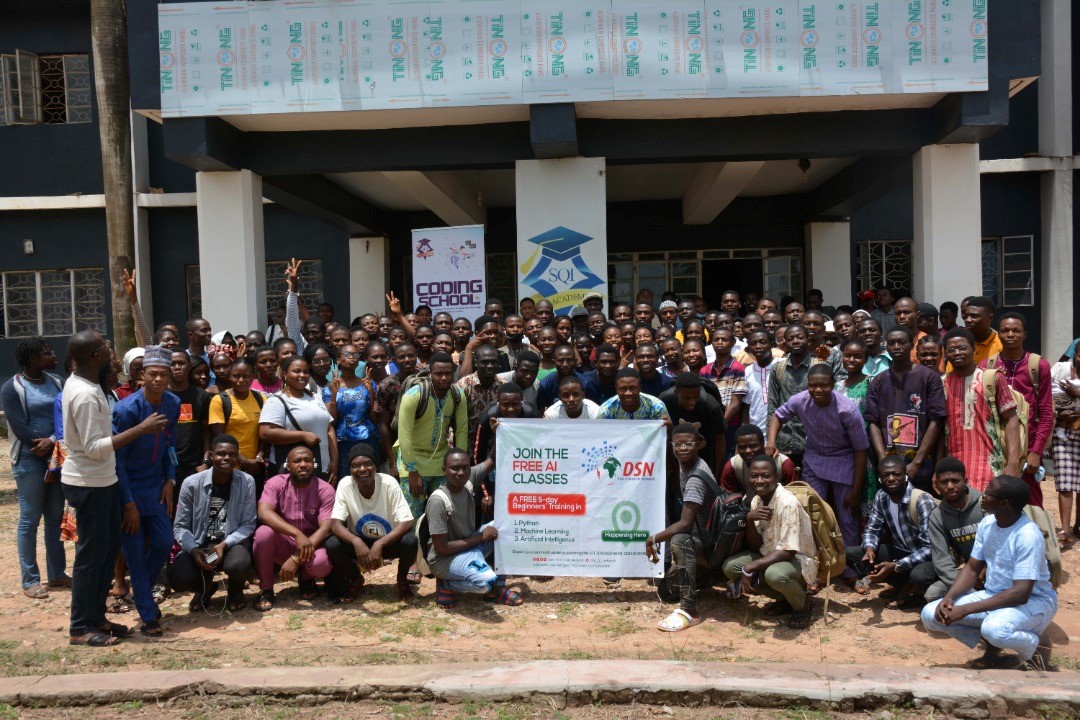
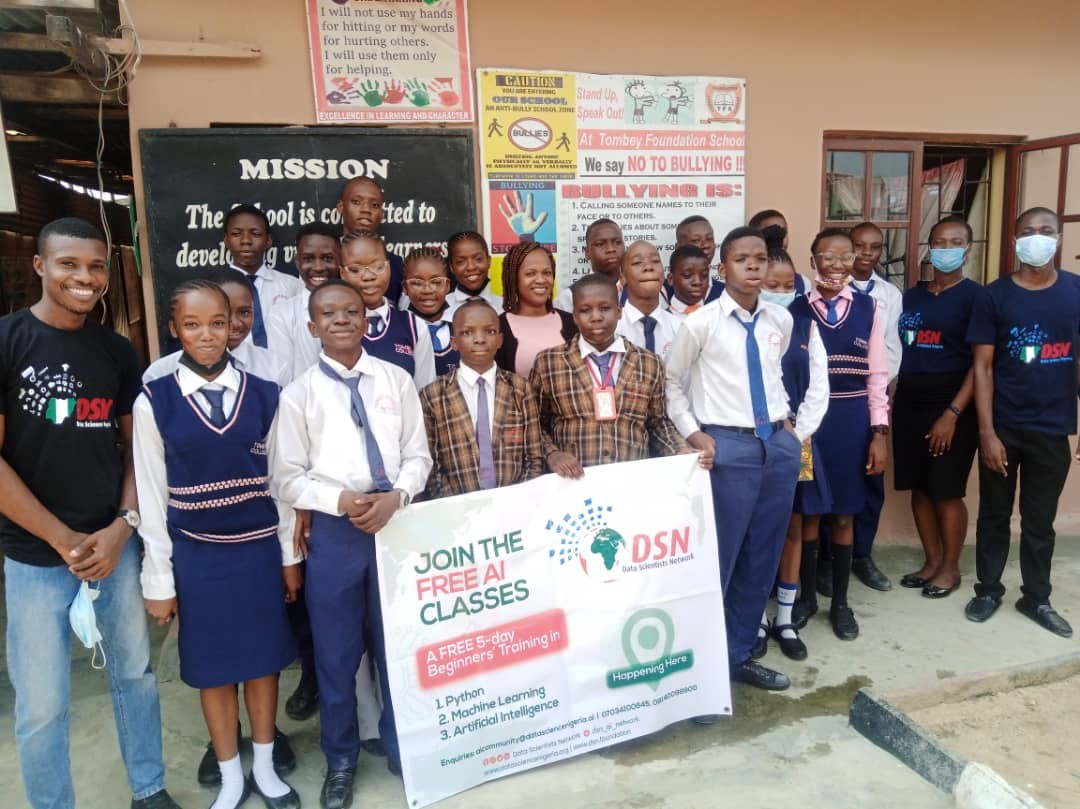
There is a well-known African proverb that goes—”A tree doesn’t make a forest.”  Likewise, the successes cultivated throughout DSN would simply not have been possible on its own. These have been achieved because of many strong partnerships and collaborations. Of note is DSN’s partnership with NVIDIA to enhance the application of knowledge and use cases, deliver additional learning content, and provide further international exposure and hands-on participation in project-based training. One such project was the Hands-on Project-based Data Visualization Masterclass organized by DSN in partnership with NVIDIA, which brought together more than 850 people online and about 100 people in person. Another such partnership was the Free AI Classes in Every City, which was held in over 120 locations in Nigeria and multiple locations in Kenya and Uganda. It is an educationally rich, five-day program that introduces participants into the world of AI. Over 7,500 people participated in the learning and then a hackathon was organized that tested the participants’ capacity. The top 400 participants were selected to receive additional learning materials provided by NVIDIA.

Kate Kallot at DSN for the Special Masterclass on Data Visualization

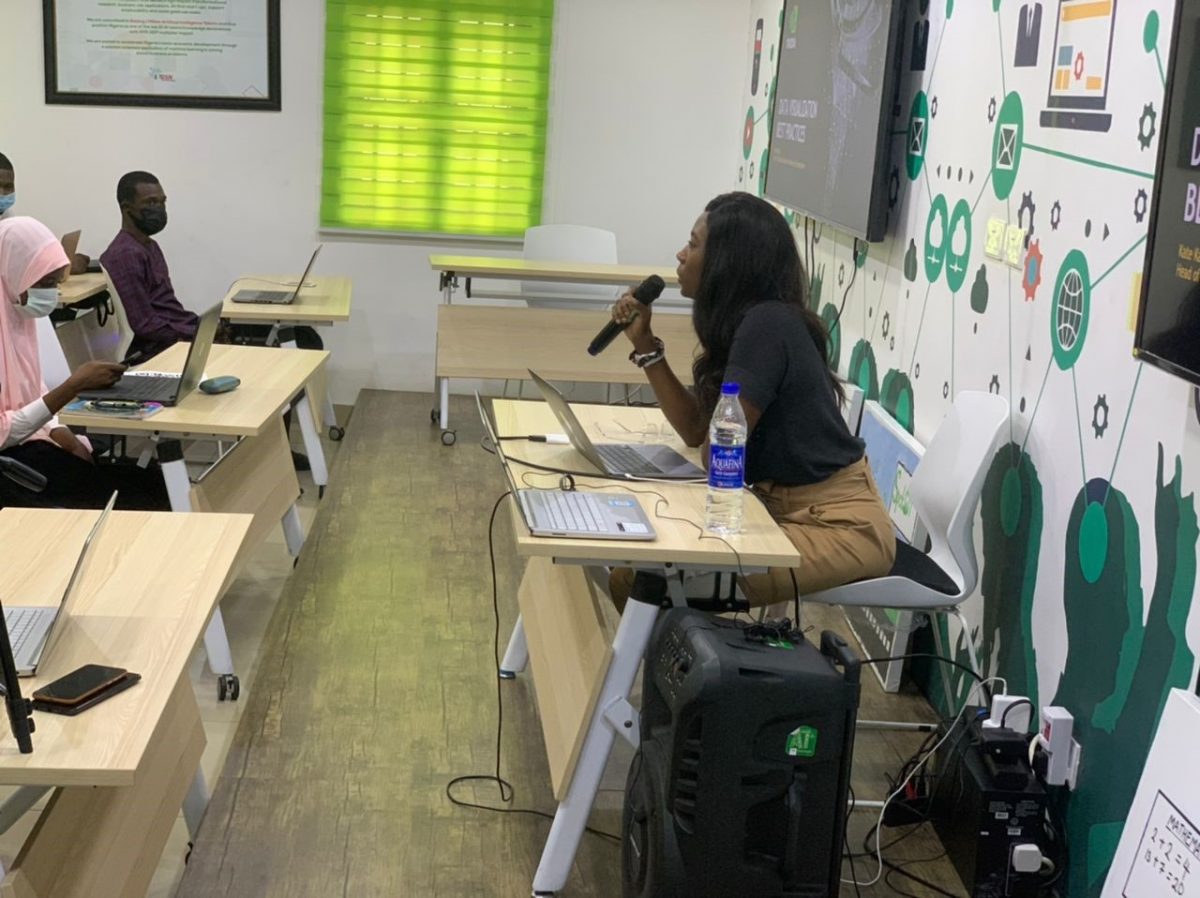
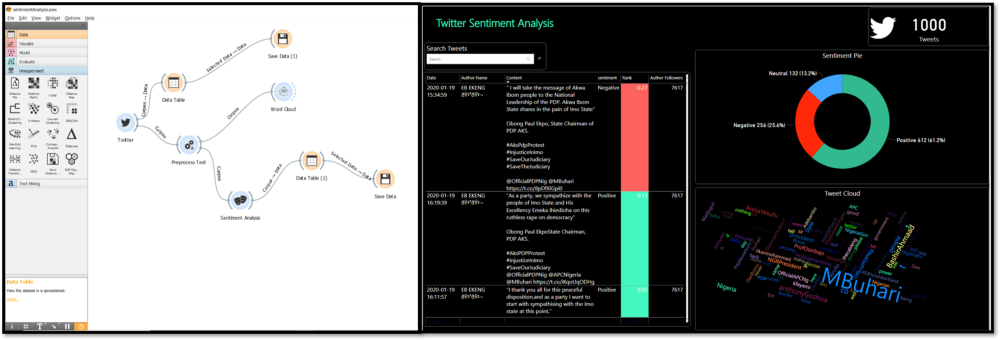
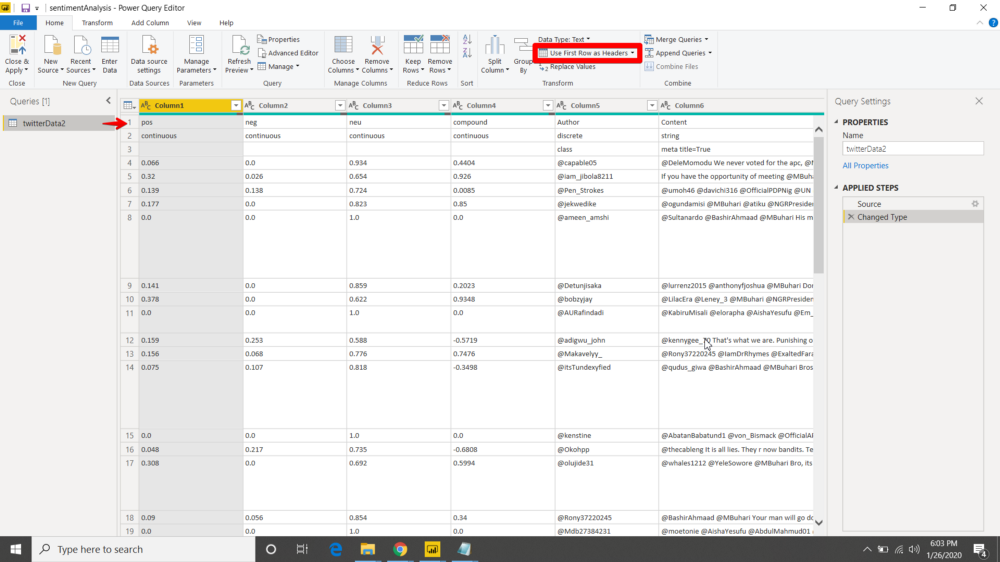
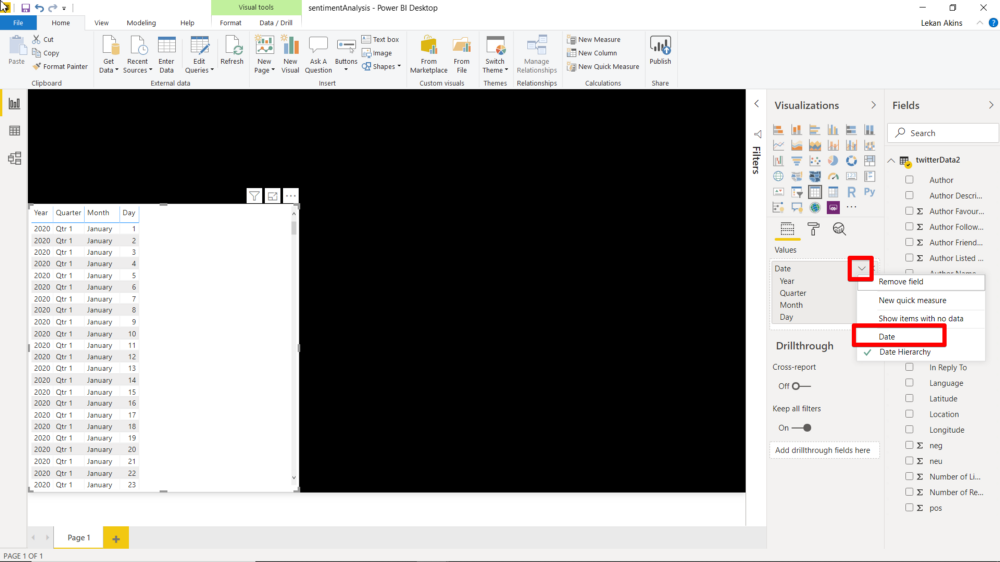
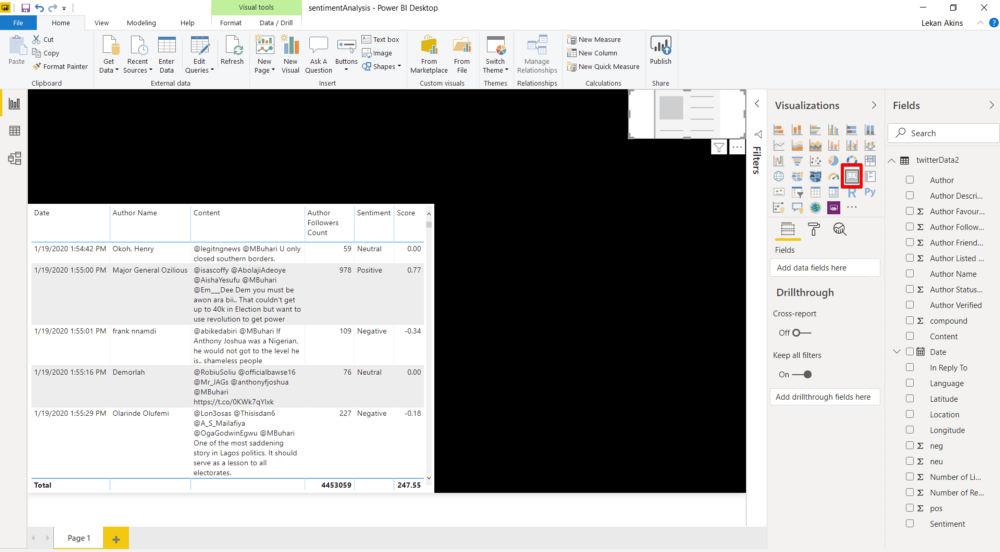
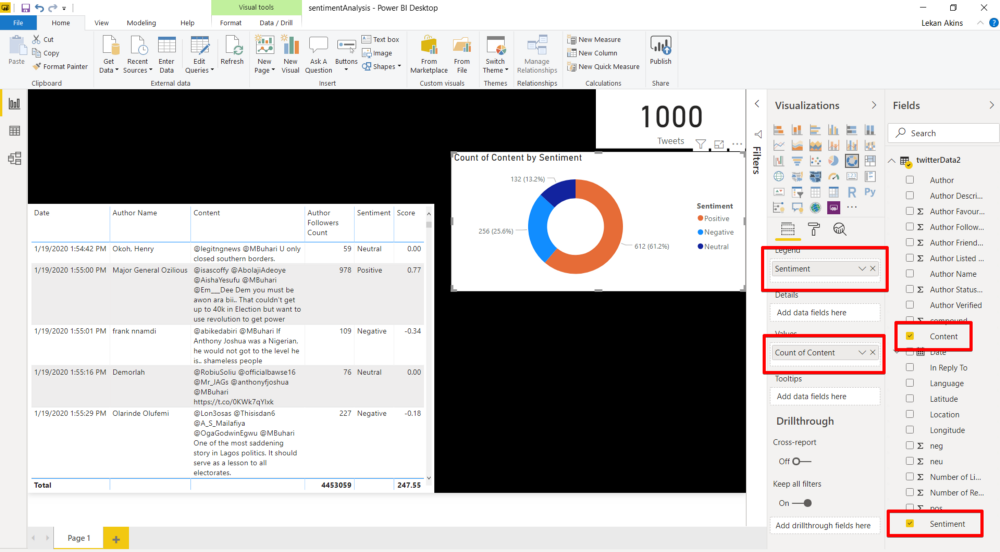
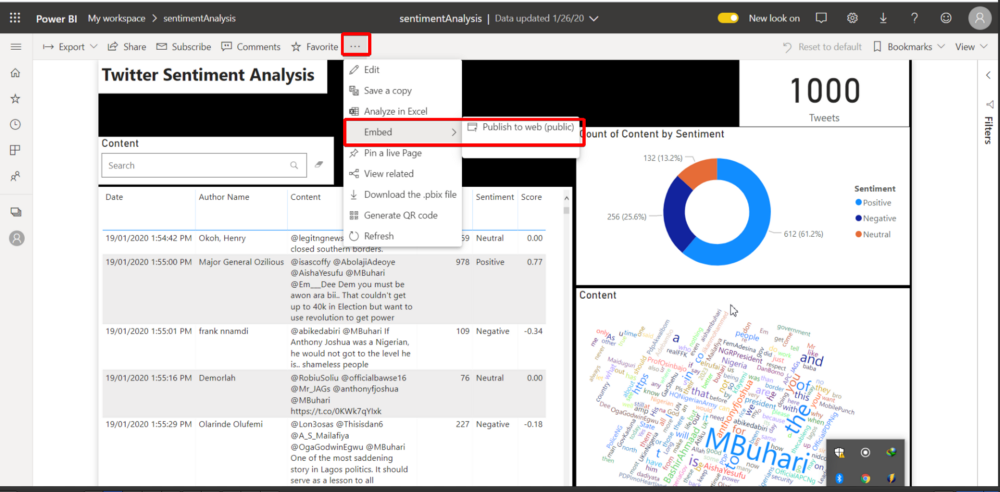
NVIDIA has been supporting DSN’s AI democratization agenda by donating workstations and other hardware like the Jetson Nano. Participation in knowledge sessions has also been supported through this partnership. For instance, in one such session, the DSN community was introduced to NVIDIA’s Omniverse. The Omniverse, much like the metaverse, is a real-time graphics collaboration platform created by NVIDIA. It has been used for applications in the visual effects and digital twin industrial simulation space. Apart from the Omniverse, NVIDIA products like CUDA were also introduced to the DSN community. NVIDIA has also been hands-on about project participation. In partnership with DSN and EFINA on a session focused on a Financial Inclusion Dashboard, participants learned how to build interactive dashboards using Power BI. This activity helped participants with real-life case studies and made them more job ready as well. Through special tickets to NVIDIA premium classes, DSN community members were placed at the forefront of cutting-edge technology and direct access to world-renowned AI professionals. NVIDIA was also involved in mentoring a DSN incubation programs for young local AI innovators and startups, providing free GCP credit units for the selected “techpreneurs”. These efforts, among many others, have significantly enriched the educational impact for so many students, demonstrating that great collaborations can move mountains.

With NVIDIA’s strategic partnership, DSN has been able to scale its outreach and widen its capacity-building portfolio. 400 DSN community members are part of the NVIDIA DLI program, while 200 will be DLI ambassadors. Also, during the partnership, DSN has opened ten new communities, increasing the total number of DSN Communities to nearly 100. DSN has also extended beyond the shores of Nigeria, building communities in Kenya and Uganda, with Ghana, Tunisia, and South Africa in the pipeline. This partnership has greatly expanded DSN’s ability to deliver learning to many young Africans, irrespective of their constrained background or lack of access to learning infrastructure. With this collaboration, DSN is able to leave a lasting and meaningful impact on many, many lives.

With these successes, DSN and NVIDIA are well positioned to explore more opportunities, such as embedding DLI classes into the university education in Nigeria, standardizing Nigeria’s learning curriculum, and using NVIDIA’s platform to accelerate research for the developer community, student ecosystem, startups, and universities. To further scale up, DSN is also exploring the possibilities of having NVIDIA’s workstations across centres of excellence throughout Nigeria’s universities. DSN and NVIDIA are looking to continue giving DLI materials to DSN’s outstanding community members, providing access to the cutting edge of learning. With this, younger, disadvantaged Africans can pick the right digital skill and translate the knowledge to the next set of people through mentorship. Therefore, through this continued cycle, DSN and NVIDIA are creating great momentum in advancing the next generation of AI and data science talent to lead the fourth industrial revolution.

Free AI Classes in Every city


January 27, 2020 0

by Akinsande Olalekan

In the first part of this article, we learned how to create a twitter developer account, how to download and install Orange3 Text Mining, and how to stream twitter data and do sentiment analysis with Orange3 Text Mining.


In this article, we will learn how to create a sentiment analysis dashboard in powerbi and deploy it to the web. This article is a continuation of Twitter Sentiment Analysis with Orange + Vader + PowerBi (Part 1); if you have not read the article, please do so.

Before we start, what is PowerBi in the first place? PowerBi is a business intelligence service by Microsoft that provides users with tools for Aggregation, Analysis, Data-Sharing, and Visualization. There are several possible ways to work with Power BI- Power BI Service(Web), Mobile, Embedded and PowerBi Desktop (Desktop App). Without much ado, let’s get started!

Step 1: Download and Install PowerBi Desktop

Power BI Desktop allows you to ingest, transform, integrate and enrich data by connecting to various data sources. This FREE desktop application simplifies data evaluation and sharing with scalable dashboards, interactive reports, embedded visuals and many more.

To download PowerBi Desktop, all you have to do is:

  1. Go here: https://www.microsoft.com/en-us/download/details.aspx?id=58494
  2. Click the download button.
  3. On the next page, select the checkbox to download the powerbi version that suits your system and click next to download.

pagePowerBi Download

To install it, simply run the downloaded .exe file and follow straightforward installation wizard prompts.

The next step is to sign up for a Powerbi account (if you would like to do so later, you can skip the registration process by clicking ‘Already have a Power BI account? Sign in’ and close the sign-in page.) If you already have an account, just use your credentials. Note: if you have an official email, I will recommend you create the PowerBi account because there are some visuals that we will import from the PowerBi Marketplace; doing this requires having a powerbi account. Now, we are ready to explore.

Step 2: Import Dataset into PowerBi

Best Practice: Save the report

As a best practice, you should save your PowerBi report before doing any other thing. To save your report, click the save button on the upper left corner of the page. Now, let’s import our sentiment analysis data ( the .csv file that was exported from the Orange3 Text Mining in the first part of our tutorial. You can download the data by clicking here .)

To build a dashboard, you have to connect to a data source. The following are the steps you need to follow to connect to a data source:

  1. Click on the ‘Get Data’ button.
  2. Select the source type; in this tutorial, we are working with a Text/CSV file

3. Locate the data in the file explorer and select it; once you connect successfully to our data source, you will see the window below:

Click Transform

Step 3: Preparing Data for the Load

Data doesn’t always come clean and prepared. Before loading data into powerbi, it is always good practice to clean the data in Power Query. To prepare data for load, click the ‘Transform Data’ button.

Power Query view

Follow these steps to prepare the data for load:

  1. Use the First row as a header: the first row of our data is good to serve as our data table header. On the Home ribbon, click ‘User first row as headers’.
  2. Remove the first 2 rows: we don’t need the first 2 rows on our data table, so let’s get rid of it. On the Home ribbon, click ‘Remove Row’ and click ‘Remove Top Rows’

Remove Rows

and input 2 in the Remove Top Row dialogue box as shown in the image below:

Remove Top Rows

3. Change Data Type: To change Data Type, click the data type button on the left side of the column name. We need to change some data to their correct data types; the following columns should be changed to Decimal Numbers, ‘pos’,’ neg’,’ neu’, and ‘compound’; the other numeric columns should be changed to the Whole Number. The Date column should be converted to Date/Time.

4. Create a Conditional Column: Let’s create a conditional column called ‘Sentiment’. The Sentiment column will help us identify the Negative, Positive and Neutral sentiments from the ‘Compound’ score. Follow these steps to create the conditional column.

4a. On the Upper ribbon, click ‘Add Column’ and select ‘Conditional Column’

4b. Now input the conditions; if ‘compound’ is less than 0, the sentiment is ‘negative’; if ‘compound’ equals 0, the sentiment is ‘neutral’; if ‘compound’ is greater than 0, the sentiment is ‘positive’. See screenshot below:

5. Load Data: Now that we prepared our data, let’s go ahead and Load. Click the Close & Apply button to load data.

Step 4: Building the Dashboard

Now that we have our data cleaned, let’s go ahead and build the dashboard.

Follow these steps to build the dashboard:

  1. Change the dashboard background: see snapshot below and follow the steps below:

Formating the background

1a. On the Visualisation pane, select the format icon

1b. Select the Page background, click the Color and select a black color. Turn color transparency to 0%. The background is now black as shown in the snapshot below:

the black background

2. Visual 1- Table: To import a visual from the visualization pane to the report space, click the visual and you’ll see it on the report space. We will start by bringing the Table visual to the report space.

Now that you have a Table in the Report space, do the following:

a. On the Data Fields, drag the date column to the value field of the table as shown in the screenshot below

We date is being displayed hierarchically; this is not what we want. So, let’s change the Date from hierarchy to normal date as shown in the screenshot below:

b. Drag the ‘Author Name’, ‘Content’, ‘Sentiment’, ‘Author Follower Count’ and the ‘Compound’ columns to the Value Field of the Visual. Rename ‘Compound’ as ‘Score’ by double-clicking it on the Value pane

Visual 2- Card: To avoid your current visual being changed by the new visual, click on the background of your report before selecting the Card visual. On the Visualisation pane, click the Card visual as shown in the screenshot below:

Now that you have the Card in the Report space, drag content into the Visual field. By default, the Card will show the First Sentence, change this by clicking the drop-down arrow on the visual and select ‘count’ as shown below:

Remember, you can rename a field name by double-clicking the name on the value field and rename it.

Visual 3- Donut: To avoid your current visual being changed by the new visual, click on the background of your report before selecting the Donut visual. Drag the ‘Sentiment’ field to the ‘legend’ and the ‘Content’ field to the ‘Value’ as shown in the screenshot below.

Visual 4- Word Cloud: Word cloud does is not among the default visualization in PowerBi, so we will have to import it as a custom visual from the PowerBi Marketplace. To import a visual from the marketplace, click the ellipse (…) and select ‘import from marketplace’ as shown in the visual below:

Note: you must be signed in to powerbi to import visual from the marketplace.

Search for ‘Word Cloud’ in the marketplace and click ‘Add’ to import the custom visual into your visualization pane as shown below:

Now that you have imported the visual from the marketplace, click the visual to add it to your Report space. Drag the content field to the category of the visual as shown in the image below:

Visual 5- Text Filter: Repeat the same process we used to import the Word Cloud visual from the marketplace to import the Text Filter. Click the Text Filter visual to add it to the report space. Drag the ‘Content’ data field into the visual field as shown below:

Visual 6- Text Box: On the ‘Home’ ribbon, click the text box icon and type, ‘Twitter sentiment Analysis’ into it as shown in the visual below:

Now you have a ready to go PowerBi Dashboard, you can choose to format this dashboard as you desire. You can read more on how to format powerbi visuals here. Finally, let’s publish our dashboard to the web so that anyone on the internet can interact with it.

Publishing to the Web

You need to have a powerbi service account to publish your dashboard.

A PowerBi Dashboard becomes interesting when you can share your beautiful dashboard. To make your dashboard available on the web, follow these steps:

  1. Publish: Click the ‘Publish’ button to push the dashboard to your powerbi service account.
  2. Once the dashboard is published, log in to your powerbi service account here
  3. Your newly published dashboard can be found under the ‘Report’ segment of your ‘My Workspace’. Click the dashboard to view on the web.
  4. To create an embedded link, you need to publish to the public web as shown in the screenshot below:

5. Publish the dashboard and a link will be generated for you as shown below:

Final Words

Congratulations on making it to the end of this article. Our dashboard is available for view here https://bit.ly/sentimentLekan. Feel free to interact with it.

Please drop your questions and comments.

Cheers!!!


January 27, 2020 0

By Akinsande Lekan

Natural Language Processing (NLP) is at the core of research in data science these days and one of the most common applications of NLP is sentiment analysis. Also known as “Opinion Mining” or “Emotion AI” Sentiment Analysis is the process of determining whether a piece of writing is positive, negative or neutral.

From opinion polls to creating marketing and public policy strategies, sentiment analysis has completely reshaped the way businesses and governance work, which is why it is an area everyone(both techies and non-techies) must be familiar with.


In this article, we will learn how to carry out Sentiment Analysis on twitter data by using Orange3 Text Mining, Vader and Microsoft PowerBi. Orange3 will be used to stream tweets from Twitter, Vader will be used for the sentiment Analysis and PowerBi will be used to create a sentiment analysis dashboard. Beyond twitter data, the knowledge gained from this tutorial can be used for sentiment analysis on any text data(surveys, polls,etc.)

There can be two approaches to sentiment analysis.

1. Lexicon-based methods

2. Machine Learning-based methods.

We will be using VADER (Valence Aware Dictionary and sEntiment Reasoner) a lexicon and rule-based sentiment analysis tool that is specifically attuned to sentiments expressed in social media.

Let’s build the solution now!

Step 1: Getting the Twitter API Credential

To access the developer account, you need to have a twitter account. In order to access the Twitter API, you need to register an application at http://apps.twitter.com. On the top-right corner, click on the Apps button, Create an App, Apply and then Continue. Next, we will choose the “I am requesting access for my own personal use” option:

On the same web page, scroll down a bit and input your Account name and Country of operation then click Continue, and you will be redirected to the next web page. Here, you can choose any Use Cases you’re interested in. For our case, I chose the following:

After you make your choice, scroll down and fill out the use case interest paragraph required. This tutorial is for learning, so make sure you emphasize on the application being a self-learning/academic-related project. Choose “No” for the government involvement question, and press “Continue”. On the next web page, read the Terms and Conditions list, agree to them then Submit Application. Now, you have to wait for Twitter to verify your developer account.

When you get the approval email, click on the login link it contains. You will be redirected to the following web page, where you should choose “Create an app”.

On the next web page, click “Create an app” from the top-right corner. After you are redirected, fill out the required app details, including — if you’d like — that it is for self-learning purposes. Click “Create”.

The next web page will include the app details that you just input, access tokens and permissions. Proceed to the “Keys and tokens” tab. Copy the API key as well as the API secret key into a safe place (a text file, if you’d like), as we will be using them in a bit. We’re done with the credential acquisition part!

Step 2: Download and Install Orange3 Text Mining

If you already have Anaconda installed on your computer, you can install orange3 from the Anaconda Navigator.

On the other hand, Orange3 can be downloaded from here: https://orange.biolab.si/download/#windows for windows users; https://orange.biolab.si/download/#macos for mac users; https://orange.biolab.si/download/#linux for Linux

Now that you have Orange3 downloaded, go ahead and install it.

Step 3: Orange3 + Vader for Twitter Streaming and Sentiment Analysis

Now that you have installed Orange3, open the application:

This is the welcome page for Orange3

Click “New” to launch a blank canvas. Orange3 offers a lot of analytics capabilities for data preprocessing, visualization, statistical modelling, and machine learning. You can watch more tutorial videos on their YouTube channel via the link: https://www.youtube.com/channel/UClKKWBe2SCAEyv7ZNGhIe4g/videos

Text Analysis doesn’t come with Orange3 by default, so we need to install the Orange-Text addon. To install, click “Options” on the home ribbon and select “Add-ons…”. Check the Orange3-Text and click okay; wait for the add-on to install.

Orange3 Add-ons window

Now that you have the Text add-on installed, let’s build the flow!

This is the flow that we will build

Follow these steps to build the Orange3 sentiment analysis flow:

  1. The Twitter Widget: Expand the Text Mining drop down on the left panel; drag and drop the ‘Twitter’ widget to the canvas.
  2. The Data Table: Expand the Data drop-down on the left panel; drag and drop the ‘Data Table’ widget to the canvas. Connect the ‘Twitter’ widget to the ‘Data Table’ by dragging any part of the dotted arc of the ‘Twitter’ widget to the ‘Data Table’ widget. NB: This is how you create connections between widgets.
  3. The Save Data: Expand the Data drop-down on the left panel; drag and drop the ‘Save Data’ widget to the canvas. Connect the ‘Data Table’ widget to the ‘Save Data’.
  4. The Preprocess Text: Expand the Text Mining drop down on the left panel; drag and drop the ‘Preprocess Text’ widget to the canvas. Connect the ‘Twitter’ widget to it.
  5. The Word Cloud: Expand the Text Mining drop down on the left panel; drag and drop the ‘Word Cloud’ widget to the canvas. Connect the ‘Preprocess Text’ widget to it.
  6. The Sentiment Analysis: Expand the Text Mining drop down on the left panel; drag and drop the ‘Sentiment Analysis’ widget to the canvas. Connect the ‘Preprocess Text’ widget to it.

Now that you have successfully set up your workflow, let’s discuss how we would work with each of these widgets to create our sentiment analyzer.

The Twitter Widget

Double click the ‘Twitter’ widget and the configuration window opens up:

Configuring the Twitter Widget

Click the ‘Twitter API Key’ button and input you ‘Consumer API Key’ and ‘Secret Key’ that was generated in Step 1

For this tutorial, we will stream 1000 tweets where the word mbuhari(the official twitter handle of the Nigerian President, President Muhammadu Buhari GCFR) was mentioned. So, if you would like to follow this article religiously, input ‘mbuhari’ in the query word list box and set the max tweets to 1000. Click ‘Start’ to start streaming data from twitter. (tweets streamed on January 19th, 2020)

The Data Table Widget

In this workflow, we made use of two ‘Data Table’ widgets. This widget allows us to view the data in a table format. The first data table is connected to the ‘Twitter’ widget. We can view this data by double-clicking the ‘Data Table’ widget.

The Save Data Widget

This widget saves data from the data table as .csv. Double click this widget to define the name and path for your file.

Note: ‘Save Data’ will only save the highlighted data on the ‘Data Table’. So, to highlight data on the data table, double click the ‘Data Table’ widget to open the ‘Data Table’ Window. Double click the ‘title’ on the top left corner of the table, the entire data table is highlighted and automatically saved to .csv

Highlighted data table will be saved

The Pre-process Text Widget

This constructs a text pre-processing pipeline. It allows us to transform, tokenize and filter our data. Double click the widget to open the Preprocess window. We want to transform our data by maintaining lower case in all tweets, removing accents, parse HTML and removing URLs; so, please check all the boxes under the Transformation section.

Under Tokenization, we are only interested in splitting by regular expressions and keeping only words. Select Regexp and type \w+ as the pattern.

Under Filtering, we will remove stop words in the English language. So, check ‘Stopwords’ and set language to ‘English’

Preprocess Text window

The Word Cloud

This widget is one of my favorite text analytics visuals. It helps you see the most mentioned words in text data. See what our cloud looks like:

The Sentiment Analysis

Double click this widget and select Vader. VADER uses a combination of a list of lexical features (e.g., words) which are generally labeled according to their semantic orientation as either positive or negative. VADER not only tells about the Positivity and Negativity score but also tells us about how positive or negative a sentiment is.


Next Part

The ‘Data Table’ that connects to the ‘Sentiment Analysis’ widget contains the tweets and the sentiment score. This is the data that we are interested in; it will serve as a database for our interactive dashboard. In the next part of this tutorial, we will explore how to create a fully functional sentiment analysis dashboard with PowerBi.

See you then!

I hope you found this tutorial interesting. Please share and remember to clap.

Cheers!!!!

You can follow me on Twitter @akinsande1

Read Part 2 here: datasciencenigeri.org/SimpleSentiment2