
Natural Language Processing (NLP) is at the core of research in data science these days and one of the most common applications of NLP is sentiment analysis. Also known as “Opinion Mining” or “Emotion AI” Sentiment Analysis is the process of determining whether a piece of writing is positive, negative or neutral.
From opinion polls to creating marketing and public policy strategies, sentiment analysis has completely reshaped the way businesses and governance work, which is why it is an area everyone(both techies and non-techies) must be familiar with.
In this article, we will learn how to carry out Sentiment Analysis on twitter data by using Orange3 Text Mining, Vader and Microsoft PowerBi. Orange3 will be used to stream tweets from Twitter, Vader will be used for the sentiment Analysis and PowerBi will be used to create a sentiment analysis dashboard. Beyond twitter data, the knowledge gained from this tutorial can be used for sentiment analysis on any text data(surveys, polls,etc.)
There can be two approaches to sentiment analysis.
1. Lexicon-based methods
2. Machine Learning-based methods.
We will be using VADER (Valence Aware Dictionary and sEntiment Reasoner) a lexicon and rule-based sentiment analysis tool that is specifically attuned to sentiments expressed in social media.
Let’s build the solution now!
Step 1: Getting the Twitter API Credential
To access the developer account, you need to have a twitter account. In order to access the Twitter API, you need to register an application at http://apps.twitter.com. On the top-right corner, click on the Apps button, Create an App, Apply and then Continue. Next, we will choose the “I am requesting access for my own personal use” option:

On the same web page, scroll down a bit and input your Account name and Country of operation then click Continue, and you will be redirected to the next web page. Here, you can choose any Use Cases you’re interested in. For our case, I chose the following:

After you make your choice, scroll down and fill out the use case interest paragraph required. This tutorial is for learning, so make sure you emphasize on the application being a self-learning/academic-related project. Choose “No” for the government involvement question, and press “Continue”. On the next web page, read the Terms and Conditions list, agree to them then Submit Application. Now, you have to wait for Twitter to verify your developer account.
When you get the approval email, click on the login link it contains. You will be redirected to the following web page, where you should choose “Create an app”.

On the next web page, click “Create an app” from the top-right corner. After you are redirected, fill out the required app details, including — if you’d like — that it is for self-learning purposes. Click “Create”.
The next web page will include the app details that you just input, access tokens and permissions. Proceed to the “Keys and tokens” tab. Copy the API key as well as the API secret key into a safe place (a text file, if you’d like), as we will be using them in a bit. We’re done with the credential acquisition part!

Step 2: Download and Install Orange3 Text Mining
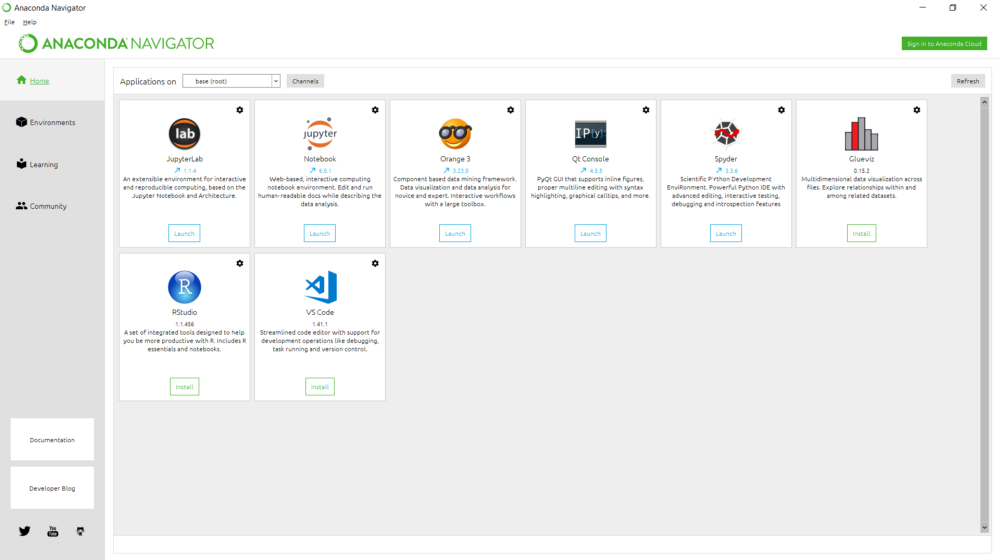
If you already have Anaconda installed on your computer, you can install orange3 from the Anaconda Navigator.
On the other hand, Orange3 can be downloaded from here: https://orange.biolab.si/download/#windows for windows users; https://orange.biolab.si/download/#macos for mac users; https://orange.biolab.si/download/#linux for Linux
Now that you have Orange3 downloaded, go ahead and install it.
Step 3: Orange3 + Vader for Twitter Streaming and Sentiment Analysis
Now that you have installed Orange3, open the application:

This is the welcome page for Orange3
Click “New” to launch a blank canvas. Orange3 offers a lot of analytics capabilities for data preprocessing, visualization, statistical modelling, and machine learning. You can watch more tutorial videos on their YouTube channel via the link: https://www.youtube.com/channel/UClKKWBe2SCAEyv7ZNGhIe4g/videos
Text Analysis doesn’t come with Orange3 by default, so we need to install the Orange-Text addon. To install, click “Options” on the home ribbon and select “Add-ons…”. Check the Orange3-Text and click okay; wait for the add-on to install.
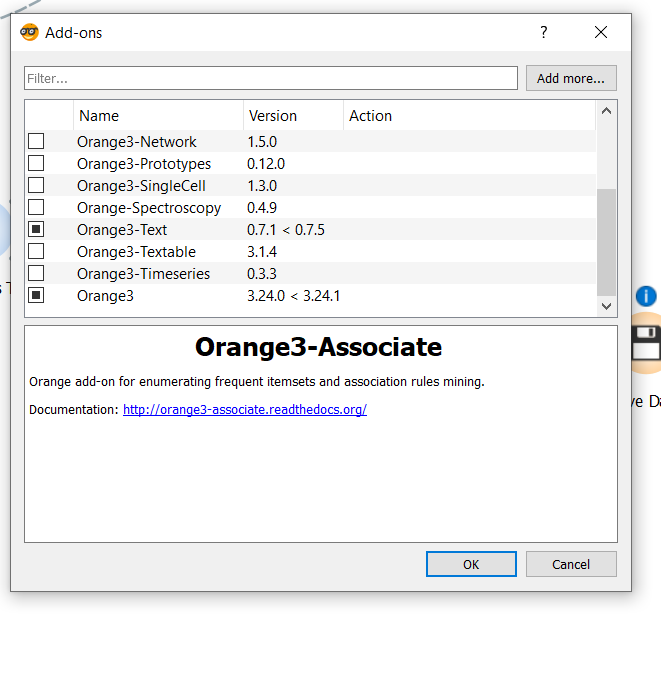
Orange3 Add-ons window
Now that you have the Text add-on installed, let’s build the flow!
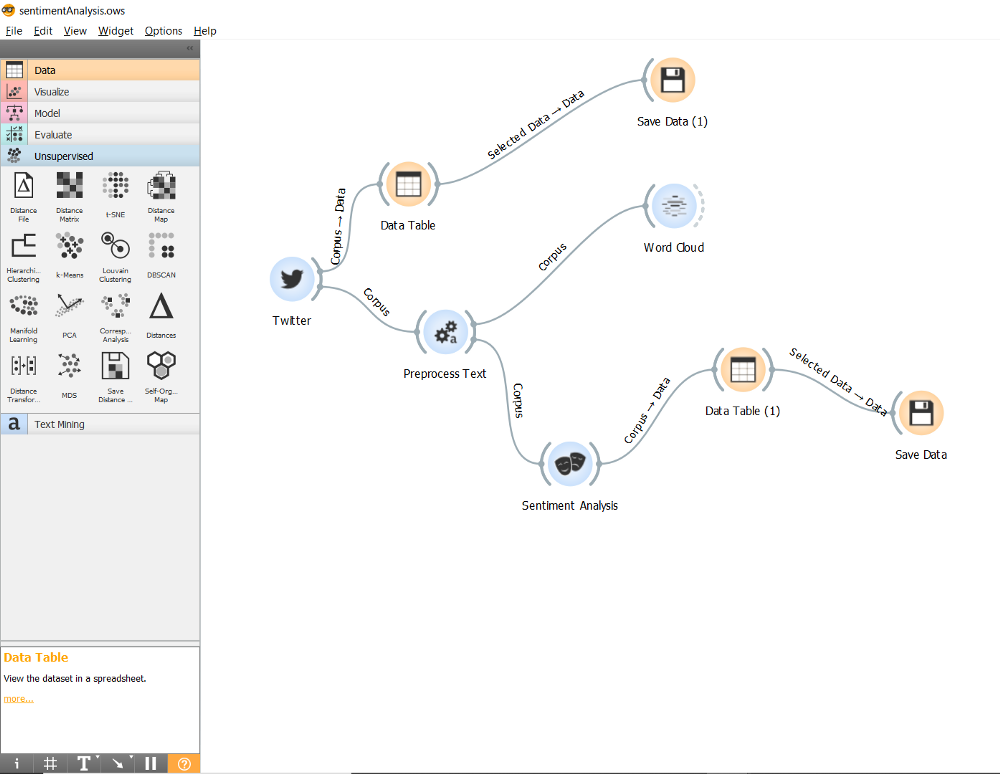
This is the flow that we will build
Follow these steps to build the Orange3 sentiment analysis flow:
- The Twitter Widget: Expand the Text Mining drop down on the left panel; drag and drop the ‘Twitter’ widget to the canvas.
- The Data Table: Expand the Data drop-down on the left panel; drag and drop the ‘Data Table’ widget to the canvas. Connect the ‘Twitter’ widget to the ‘Data Table’ by dragging any part of the dotted arc of the ‘Twitter’ widget to the ‘Data Table’ widget. NB: This is how you create connections between widgets.
- The Save Data: Expand the Data drop-down on the left panel; drag and drop the ‘Save Data’ widget to the canvas. Connect the ‘Data Table’ widget to the ‘Save Data’.
- The Preprocess Text: Expand the Text Mining drop down on the left panel; drag and drop the ‘Preprocess Text’ widget to the canvas. Connect the ‘Twitter’ widget to it.
- The Word Cloud: Expand the Text Mining drop down on the left panel; drag and drop the ‘Word Cloud’ widget to the canvas. Connect the ‘Preprocess Text’ widget to it.
- The Sentiment Analysis: Expand the Text Mining drop down on the left panel; drag and drop the ‘Sentiment Analysis’ widget to the canvas. Connect the ‘Preprocess Text’ widget to it.
Now that you have successfully set up your workflow, let’s discuss how we would work with each of these widgets to create our sentiment analyzer.
The Twitter Widget
Double click the ‘Twitter’ widget and the configuration window opens up:

Configuring the Twitter Widget
Click the ‘Twitter API Key’ button and input you ‘Consumer API Key’ and ‘Secret Key’ that was generated in Step 1
For this tutorial, we will stream 1000 tweets where the word mbuhari(the official twitter handle of the Nigerian President, President Muhammadu Buhari GCFR) was mentioned. So, if you would like to follow this article religiously, input ‘mbuhari’ in the query word list box and set the max tweets to 1000. Click ‘Start’ to start streaming data from twitter. (tweets streamed on January 19th, 2020)
The Data Table Widget
In this workflow, we made use of two ‘Data Table’ widgets. This widget allows us to view the data in a table format. The first data table is connected to the ‘Twitter’ widget. We can view this data by double-clicking the ‘Data Table’ widget.

The Save Data Widget
This widget saves data from the data table as .csv. Double click this widget to define the name and path for your file.

Note: ‘Save Data’ will only save the highlighted data on the ‘Data Table’. So, to highlight data on the data table, double click the ‘Data Table’ widget to open the ‘Data Table’ Window. Double click the ‘title’ on the top left corner of the table, the entire data table is highlighted and automatically saved to .csv
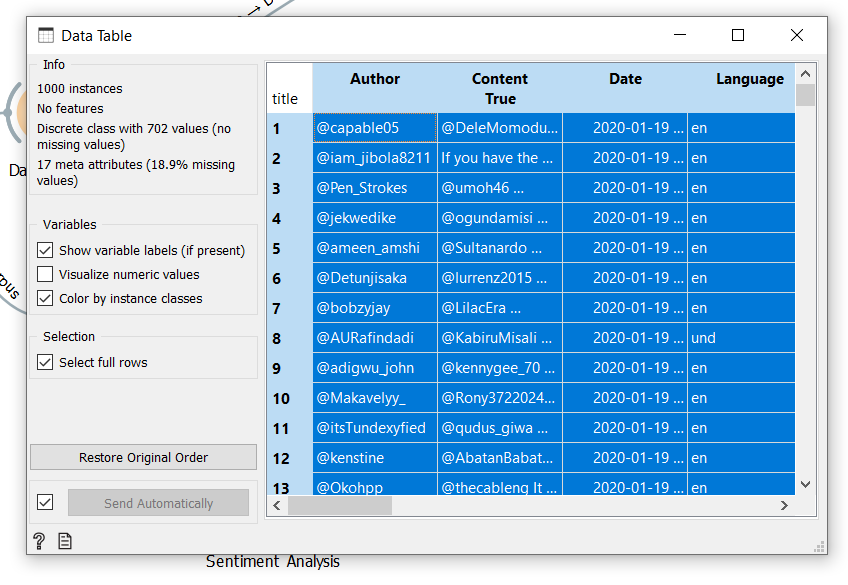
Highlighted data table will be saved
The Pre-process Text Widget
This constructs a text pre-processing pipeline. It allows us to transform, tokenize and filter our data. Double click the widget to open the Preprocess window. We want to transform our data by maintaining lower case in all tweets, removing accents, parse HTML and removing URLs; so, please check all the boxes under the Transformation section.
Under Tokenization, we are only interested in splitting by regular expressions and keeping only words. Select Regexp and type \w+ as the pattern.
Under Filtering, we will remove stop words in the English language. So, check ‘Stopwords’ and set language to ‘English’

Preprocess Text window
The Word Cloud
This widget is one of my favorite text analytics visuals. It helps you see the most mentioned words in text data. See what our cloud looks like:

The Sentiment Analysis
Double click this widget and select Vader. VADER uses a combination of a list of lexical features (e.g., words) which are generally labeled according to their semantic orientation as either positive or negative. VADER not only tells about the Positivity and Negativity score but also tells us about how positive or negative a sentiment is.

Next Part
The ‘Data Table’ that connects to the ‘Sentiment Analysis’ widget contains the tweets and the sentiment score. This is the data that we are interested in; it will serve as a database for our interactive dashboard. In the next part of this tutorial, we will explore how to create a fully functional sentiment analysis dashboard with PowerBi.
See you then!
I hope you found this tutorial interesting. Please share and remember to clap.
Cheers!!!!
You can follow me on Twitter @akinsande1
Read Part 2 here: datasciencenigeri.org/SimpleSentiment2